


In 1973, the University of California, Berkeley was accused of gender bias in its graduate school admissions process. The overall data showed that men were more likely to be admitted than women. The table displays admission statistics for men and women in two faculties — A and B — that make up the Berkeley graduate program.
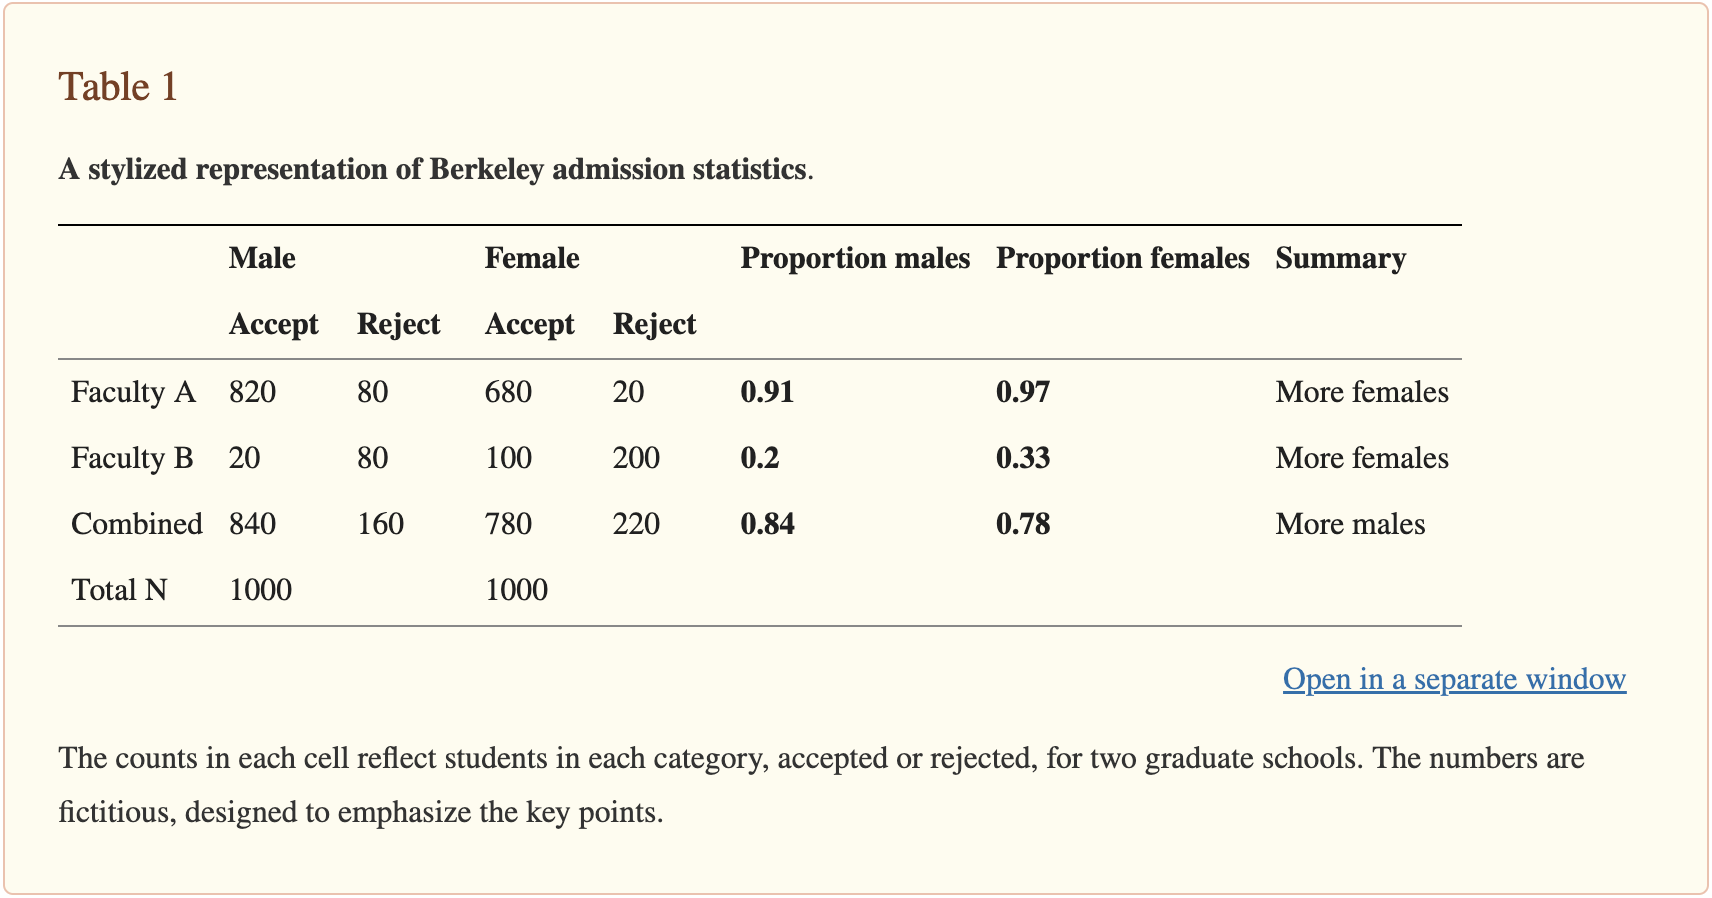
Proportionally, fewer women were admitted to graduate school compared to men: 84% men and 78% women. However, when we look at the admission rates for each individual school (A and B), we observe the opposite trend: in both Schools A and B, a higher percentage of women were admitted compared to men: 97% vs 91% in School A and 33% vs 20% in School B.
The paradox occurred because women disproportionately applied to highly competitive departments with low admission rates, while men tended to apply to departments with higher admission rates. When the data was aggregated, it appeared as if there was gender bias, even though it was actually the different application patterns that caused the disparity.
Here’s another discussion that you might be familiar with.
It might feel obvious that educating women increases their hiring prospects and enables them to be financially independent.
However, the table below explores the relationship between education, economic status, and workforce participation rates (WPR) for men and women in rural and urban areas.
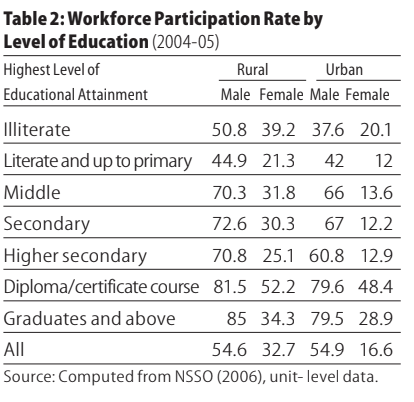
Based on this report, the gender differences in whether education leads to employment are stark.
For men, higher levels of education are associated with higher workforce participation rates (WPR) in both rural and urban areas. However, for women, WPR is higher for illiterate women than for women with higher levels of school education. This pattern reverses itself only for women with technical/vocational education or graduates. The trend is apparent in both rural and urban areas.
Strange, right?
In rural areas, 51% of illiterate men are employed, while 71% of men who have passed higher secondary are employed. On the other hand, 39% of illiterate rural women are employed, while only 25% of rural women who have passed higher secondary are employed.
So, what is happening here?
The economic status of women is critical to their participation in work.
For rural women, as their economic status (measured by monthly per capita consumption expenditure, or MPCE) increases, their work participation rate (WPR) decreases. This suggests that poorer rural women are more likely to work out of economic necessity.
In urban areas, the relationship between economic status and work participation for women forms a V-shape. Women with low and high economic statuses have higher work participation rates, while those in the middle have lower rates. This pattern may be due to better education and more job opportunities for women in higher-income groups in urban areas.
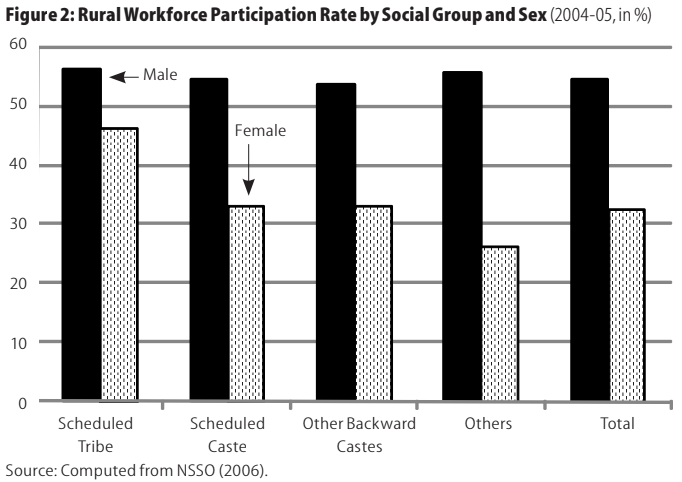
Additionally, women's participation in gainful work is lower than men's participation but higher for SC and ST women, who are less restricted by social norms and more compelled by economic reasons to work.
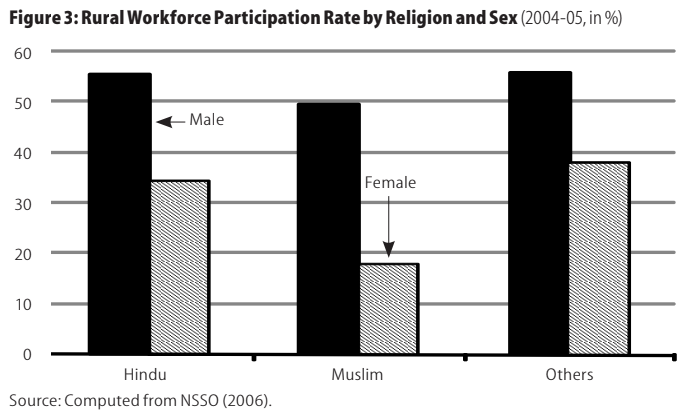
Among religious groups, work participation is lowest for Muslim women. The effects of education differ for men and women, with the level of participation increasing with educational levels for men but declining for rural women.
So what we find out is: as economic status improves, work participation declines for rural women, suggesting that when there are no compelling economic reasons to earn, social taboos on women's mobility and participation in work exercise a strong influence.
From the two examples cited above, it is easy to note that in case a third variable was to be introduced to the inferences made from the old data, the causal links would probably collapse and tell an altogether new story.
Statistically, you would refer to them as a lurking variable. True to its name, detecting the lurking variable in an experiment can be difficult.
In the case of Berkeley admissions, you might find out that women were applying for courses that had lower acceptance rates overall, and that affected the overall acceptance rate results.
In the case of women’s participation in the workforce, you note that merely educational advancement is no guarantee for employment. The woman’s social class, caste status, and religion play a significant role in deciding how related education and employment are.
But lurking variables and their effect on research or data is not new. It is a well-documented and routinely occurring phenomenon called...
...The Simpson’s Paradox.
Simpson's Paradox is a phenomenon in which a trend that appears within different groups reverses or disappears when those groups are combined. It occurs when there is a lurking or confounding variable that isn't considered in the analysis.
Put simply, it refers to a situation where you believe you understand the direction of a relationship between two variables, but when you consider an additional variable, that direction appears to reverse. It occurs when disaggregating data, such as dividing it into subgroups, can result in certain subgroups having an unequal representation compared to others.
Let's look at two generalized examples of Simpson's Paradox in a startup context, one related to product decisions and another related to marketing decisions.
1. Feature Impact on User Retention
Imagine a startup that has developed a project management app. They recently introduced two new features, Feature X and Feature Y. The startup wants to determine the impact of these features on user retention.
The aggregated data shows:
Users with Feature X: 70% retention rate
Users with Feature Y: 80% retention rate
At first glance, it seems that Feature Y is more effective in retaining users. However, when the data is broken down by user type (beginner and advanced), a different trend emerges:
Beginner users:
Feature X: 85% retention rate
Feature Y: 65% retention rate
Advanced users:
Feature X: 55% retention rate
Feature Y: 95% retention rate
When considering user types separately, Feature X retains beginner users at a higher rate, while Feature Y is more effective for advanced users. The paradox occurs because user type acts as a confounding variable. If the startup only looked at the aggregated data, they might erroneously conclude that Feature Y is better for all users and decide to prioritize its development or promotion, potentially alienating beginner users.
A similar thing can happen while measuring content effectiveness on a particular marketing channel.
2. Measuring Content Effectiveness
An ed-tech startup wants to evaluate the effectiveness of two different kinds of content styles, Style A (more topical content with spicy gossip and hot takes) and Style B (more serious and nuanced content), to determine what style of content to go ahead with. They look at the overall engagement rate for each type of content over the span of a month:
Style A: ~5 mn impressions, 1.5% engagement rate
Style B: ~800k impressions, with 0.7% engagement rate
Based on this data, it appears that Style A is vastly more effective. However, when the data is broken down by conversion rates, the results are different:
For customers who converted, style B of content generated way higher conversion and product purchases than style A. Upon further research, the startup also found that style A of content actively dissuaded some consumers with real intent from buying the product!
In this case, conversion rate — a hard metric to attribute to specific content — acted as a confounding variable. Style A is more effective for engagement with a wider audience base and building awareness, while Style B is more effective for actually converting consumers. If the startup only focused on the overall engagement rate, they might focus on going all in on Style A content, potentially missing out on attracting really serious individuals.
As operators who have access to large swathes of data, being aware of Simpson's Paradox is crucial.
People often assume that statistical relationships are fixed, but this is not always the case. The association between two variables can increase, decrease, or even change direction depending on the variables being examined. Unobserved or uncontrolled variables could exist that would eliminate or even reverse the observed association between two variables.
In conclusion, this view offered by Tom Grigg highlights the essential:
“Simpson’s paradox highlights one of my favourite things about data: the need for good intuition regarding the real world and how most data is a finite-dimensional representation of a much larger, much more complex domain.
The art of data science is seeing beyond the data — using and developing methods and tools to get an idea of what that hidden reality looks like. Simpson’s paradox showcases the importance of scepticism and interpreting data with respect to the real world, and also the dangers of oversimplifying a more complex truth by trying to see the whole story from a single data viewpoint.”
